 SessionTap
Weekly behavior tracking sheet
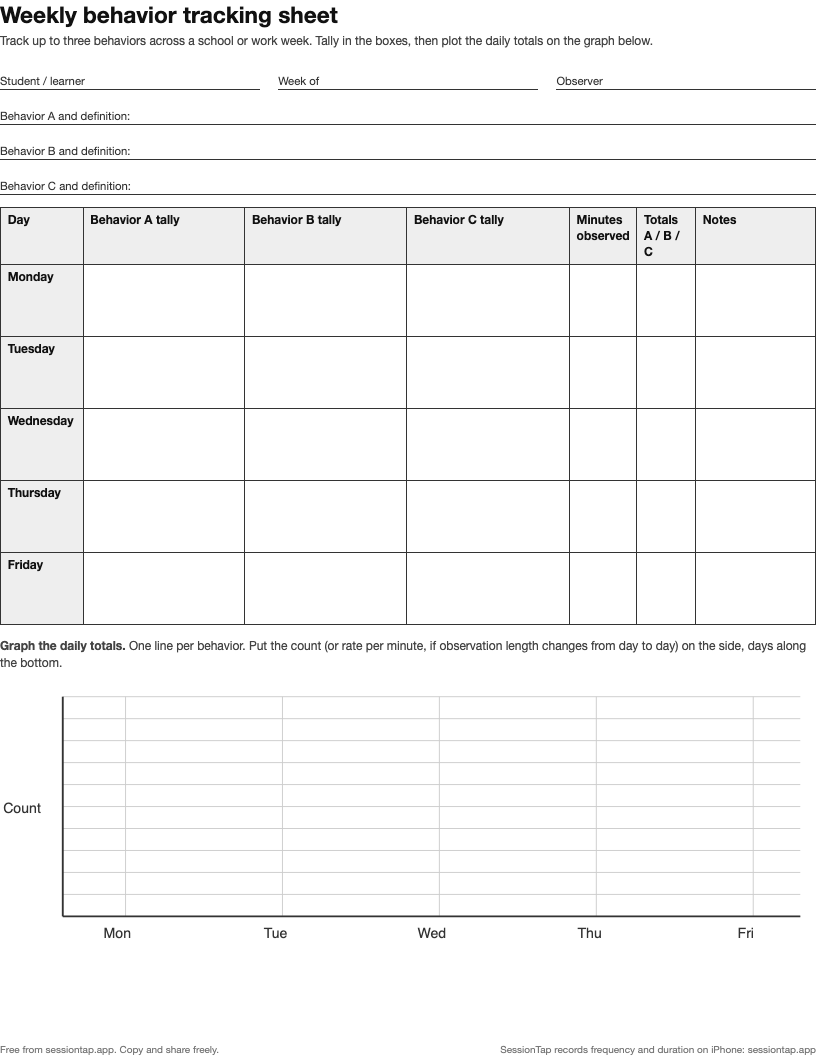
One page per week for up to three behaviors. Tally each day, write the totals and plot them on the graph at the bottom, so a trend is visible without opening a spreadsheet.
How to use it
- Pick at most three behaviors and write a short definition for each. Choose at least one behavior you want to see more of (raising a hand, asking for a break, completing work), not only ones you want to see less of.
- Decide when you will observe each day: the whole day, or the same block each day (for example, the 30 minutes of independent work after lunch). Watching the same block makes days comparable.
- Tally during the observation and write the minutes observed.
- At the end of the day, write the totals and put a dot on the graph for each behavior. Join the dots across the week.
If the minutes observed change from day to day, plot the rate (count ÷ minutes) instead of the count, or a short day will look like an improvement.
Reading the graph
Look at the direction over several days rather than a single day. One bad Thursday after a fire drill is not a trend; three weeks of rising totals is. If you are tracking an IEP goal, the teachers page has more on turning the totals into progress-report numbers.
On a phone
SessionTap counts and times behaviors on iPhone during the observation and gives you the totals and rates the moment you end it. Export the sessions as CSV files and a spreadsheet can draw the weekly graph for you.